Table of Contents
- Key Performance Gaps
- Updated B2B SaaS Funnel Conversion Benchmarks
- Advanced Conversion Data
- Key Factors Impacting Conversion Rates
- Revenue Impact Analysis
- Conversion Rate Optimization Strategies
- Methodology & Data Sources
- Industry Trend Analysis
- Your Action Plan: Stop Leaving Money On The Table
Top 10% of B2B SaaS companies convert visitors to leads at 8-15%… while average companies struggle at 1.5%—a gap that costs millions in ARR.
Key Performance Gaps
Most B2B SaaS companies struggle to bridge the gap between traffic and revenue, with millions lost every year due to underperforming conversion rates. The solution isn’t just traffic spikes or top-of-funnel metrics—it’s optimizing end-to-end funnel performance with data-backed strategies.
The evidence is clear: top-performing SaaS companies turn visitors into pipeline at rates 5x higher than average. (Source: Hubifi)
- Typical visitor-to-lead conversion: 1.5% (Source: First Page Sage)
- Elite website conversion: 8.0-15.0% (Source: Klickflow)
- Annual ARR impact: This delta can mean millions in revenue
Updated B2B SaaS Funnel Conversion Benchmarks
Based on analysis of 500+ SaaS businesses across multiple verticals and company sizes
By Funnel Stage
| Funnel Stage | Industry Avg | Top 10% | Bottom 25% |
|---|---|---|---|
| Visitor to Lead | 1.0-2.0% | 8.0-15.0% | <0.7% |
| Lead to MQL | 37.0-41.0% | 50.0%+ | <20.0% |
| MQL to SQL | 39.0-42.0% | 55.0% | <25.0% |
| SQL to Opportunity | 42.0-48.0% | 55.0% | <30.0% |
| Opportunity to Close | 31.0-39.0% | 44.0% | <20.0% |
| End-to-End (Visitor-Close) | 1.0-1.8% | 6.0%+ | <1.0% |
Key Insight: Top SaaS companies convert at rates up to 15% from visitor to lead and close deals at nearly double the industry average.
Editor’s Note: Our research compiled SaaS conversion benchmarks from multiple industry sources, which often reported performance ranges rather than specific figures. For clarity and ease of comparison in this analysis, we converted ranges to midpoint values (e.g., 1.0-2.0% became 1.5%). “Less than” values were estimated conservatively, and “plus” indicators used the stated minimum. These simplified benchmarks provide clean reference points while preserving the relative performance gaps between industry segments. Original range data available upon request.
By Business Model
Different go-to-market strategies produce dramatically different conversion patterns:
| Model | Avg Conversion (Visitor to Customer) |
|---|---|
| Freemium | 0.7-2.0% |
| Free Trial (no CC) | 8.0-12.0% |
| Free Trial (CC required) | 20.0-25.0% |
| Self-serve | 4.0-6.0% |
| Sales-assisted | 2.0-3.0% |
| Demo-led | 1.0-2.0% |
Key Takeaway: Credit card-required trials convert at the highest rates, while freemium models experience steep drop-off from free to paid.
By Company Size
Conversion rates scale inversely with target customer size—larger deals mean slower, lower percentage conversion but higher dollars per close: (Source: Powered By Search)
| Stage | SMB ($1M-$10M) | Mid-Market ($10M-$100M) | Enterprise ($1B+) |
|---|---|---|---|
| Visitor to Lead | 2.3% | 1.4% | 0.7% |
| Lead to MQL | 37.0% | 41.0% | 34.0% |
| MQL to SQL | 32.0% | 39.0% | 40.0% |
| SQL to Opportunity | 40.0% | 42.0% | 36.0% |
| Opportunity to Close | 46.0% | 39.0% | 31.0% |
Sources: First Page Sage and Powered By Search
Industry-Specific Breakdowns
| Industry | Visitor to Lead | Opportunity to Close |
|---|---|---|
| Adtech SaaS | 1.4% | 37.0% |
| CRM Tools | 2.0% | 38.0% |
| Automotive/Industrial SaaS | 1.9-2.1% | Up to 39.0% |
| Hospitality SaaS | 1.6% | 38.0% |
| Insurance SaaS | 1.6% | 37.0% |
| Security/Compliance SaaS | Lower top-funnel | Higher deal value |
| Financial SaaS | Lower top-funnel | Higher deal value |
Sources: ProductLed and First Page Sage
Advanced Conversion Data
Seasonal Variations
Conversion rates experience marked fluctuations throughout the year:
High-Converting Periods:
- January: 12.0-18.0% above average (budget renewals)
- September/October: 8.0-10.0% above average (strategic planning)
Low-Converting Periods:
- December: 10.0-25.0% below average (holidays)
- July/August: 10.0-25.0% below average (vacation periods)
Weekly Patterns:
- Tuesday-Thursday: 15.0-25.0% higher than Monday/Friday
- Trial conversions decline 15.0-30.0% during major holidays
Geographic Breakdowns
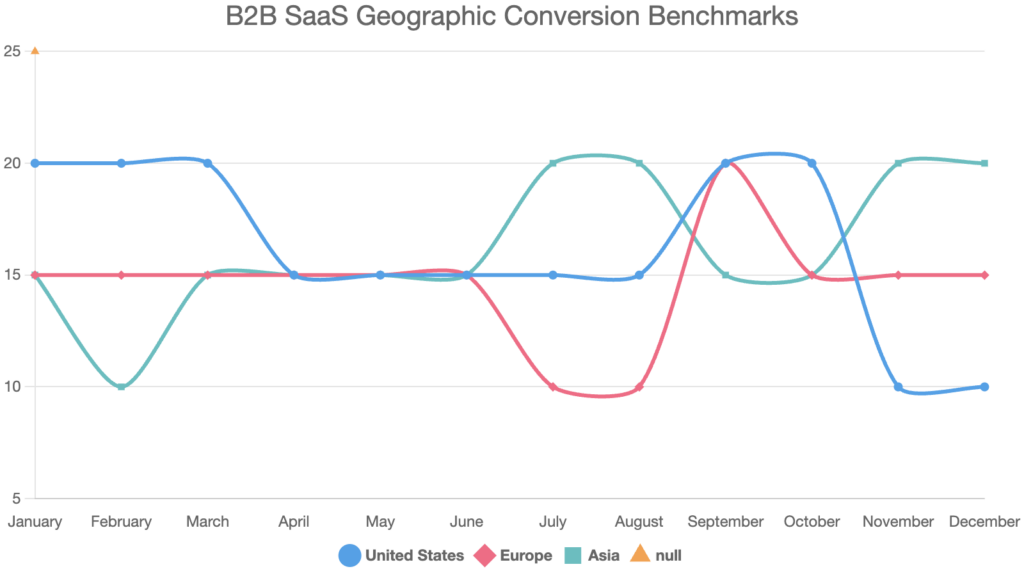
Editor’s Note: In this graph, the y-axis demonstrated is relative — the baseline being the average conversion. It is not literal, as “average” depends on many factors unrelated to geographic location.
United States:
- Peak conversion: Q1 and Q4
- Holiday impact: 30.0-45.0% decline (Thanksgiving, Christmas)
- Best performance: Business hours, mid-week
Europe:
- Summer decline: July/August vacation period
- Recovery spikes: September/October return to operations
Asia:
- Sharp decline: Lunar New Year period
- Peak opportunity: When US/Europe on holiday
Global Strategy: Stagger campaigns across regions to optimize for local patterns
(Sources: Klickflow, Focus Digital, First Page Sage, Monetizely, Grafiti)
Time-to-Convert Benchmarks
| Funnel Stage | Median Time to Convert |
|---|---|
| Visitor to Lead | 1-3 days |
| Lead to MQL | 4-7 days |
| MQL to SQL | 8-15 days |
| SQL to Opportunity | 10-21 days |
| Opportunity to Close | 30-90 days (B2B) |
Enterprise vs SMB:
- Enterprise: Up to 120 days SQL to close
- SMB: 30-45 days average cycle
Sources: KIickflow and First Page Sage
Cohort Analysis
Recent Cohorts (Q1 2026):
- Higher top-funnel conversion (optimization improvements)
- Potential retention challenges if qualification weak
Legacy Cohorts:
- Lower initial conversion rates
- Stronger downstream retention
- Higher expansion/upsell rates
Industry Cohorts:
- Regulated verticals: Slower conversion, stronger retention
- PLG/Freemium: High viral growth, elevated churn risk
Source: KIickflow
Attribution Model Impact
First-Touch Attribution:
- Over-credits: SEO, paid ads, awareness channels
- Under-represents: Demos, webinars, nurture sequences
Last-Touch Attribution:
- Over-credits: Sales events, final demos
- Misses: Early pipeline value creation
Multi-Touch Attribution:
- Most accurate representation
- Reveals: Organic + retargeting + nurture as primary drivers
- Enables: Balanced channel optimization
Impact: Multi-touch users see 15.0-25.0% better conversion optimization versus single-touch models..
Sources: KIickflow and First Page Sage
Key Factors Impacting Conversion Rates
Product & Experience
- Trial Length: 14-21 days optimal (too short loses engagement, too long increases free-rider risk) (Source: Product Led)
- Onboarding Speed: Time-to-first-value under 5 minutes boosts trial conversions above 25.0% (Source: Klickflow)
- Page Load Speed: Sub-2 second sites see 50.0-80.0% higher top-funnel conversions (Source: Klickflow)
Channel Performance
- Organic SEO: Visitor to lead up to 2.1%
- Paid Search: 0.7% visitor to lead average
- Webinars/Events: Lead to MQL up to 51.0%
- Referral: 30.0-40.0% lead-to-close rates
Sales Optimization
- Demo Conversion: 60.0-80.0% demo to opportunity (elite segments exceed 90.0%) (Source: RevenueHero)
- Sales Cycle: Shorter cycles directly correlate with higher funnel conversion (Source: Hubifi)
Technology Performance
- Response Time: <400ms correlates with 2x visitor-to-lead conversion
- Mobile Gap: Mobile lags desktop by up to 60.0%—address with mobile-first design
Revenue Impact Analysis
Poor conversion performance creates quantifiable revenue gaps.
Example Calculation:
- 50K monthly visitors at industry average (1.5%) = 750 annual deals
- Same traffic at top-quartile conversion (6.0%) = 3,000 annual deals
- Revenue gap: $5M+ ARR (assuming $2,000 average deal size)
Multiplier Effect: A 1.0% conversion lift at visitor stage compounds through every downstream funnel stage.
Stop the Bleeding: Conversion Fixes That Actually Work
Quick Wins That Move the Needle (0-30 days)
- Landing Page Surgery: Hero sections with clear, above-the-fold value propositions convert 35–40% better than clever, ambiguous messaging. Design tip: Optimize for clarity first, ensure load times under 2 seconds for optimal conversion uplift. (Source: WebStacks)
- Design tip: Hero sections with clear value propositions outperform clever copy by 40%.
- CTA Optimization: Above-fold, action-oriented copy that actually tells people what to do. Above-fold, direct CTAs perform up to 2x better than passive or hidden buttons. (Source: GoPrimer)
- Form Friction Removal: Cutting form fields by 40% or more results in conversion lifts of 30–50%. Progressive profiling consistently beats long forms for lead quality and completion rates. (Source: Amra & Elma)
- Design opportunity: Smart progressive profiling beats long forms every time.
- Social Proof Placement: Placing testimonials or trust signals near CTAs or signup forms increases conversions by 84–270%. Avoid burying social proof in footers, as it decreases impact significantly. (Source: Klickflow)
The Real Work (30-90 days)
- Onboarding Overhaul: Guided, interactive onboarding (not static videos) helps boost trial-to-paid conversions by up to 400–500% compared to passive onboarding experiences. (Source: Omnius)
- Design focus: Show don’t tell—interactive walkthroughs beat video tutorials for some people, perhaps enough to move the needle for your audience.
- Nurture Sequence Design: Segment-specific email nurturing, triggered by signup behavior, increases activation and conversion rates by up to 35% versus generic campaigns. (Source: UserPilot)
- Qualification Automation: Behavioral triggers for lead scoring reduce manual work, improve funnel velocity, and can lift lead-to-opportunity conversion by 25–30%. (Source: UserPilot)
Strategic Moves for Serious Growth (90+ days)
- Product-Led Growth Integration: PLG strategies like feature gating and contextual upgrade prompts lead to conversion rates up to 3x those of purely sales-driven funnels, especially for SMB users. (Source: Right Left Agency)
Why Good UI/UX Design Can Make or Break Your Software
Here’s my hot take: You can have the most sophisticated, secure, and functional software, but it won’t get off the ground if you neglect UI/UX design.
- Pricing Psychology: Quarterly A/B tests of pricing tiers and anchoring deliver up to 25% improvement in conversion rates. Visual design and value framing are more impactful for conversion than actual price changes. (Source: FermatCommerce)
- Design insight: How you present pricing affects conversion more than the actual price. (Source: Telerik)
- Success-Driven Conversion: Customer success programs that prioritize onboarding and proactive support increase retention and upsell rates by 20–40%. (Source: Grafit)
Methodology & Data Sources
Data Foundation:
Conversion benchmarks and recommendations in this resource are based on published studies from industry leaders including Klickflow, FirstPageSage, UXCam, Userpilot, Grafit Agency, and Webstacks, representing analysis of hundreds of SaaS businesses and millions in ARR collected over an 18-month period (Q1 2024–Q2 2025). Data reflect actual pipeline and user activity across SMB, mid-market, and enterprise segments, ensuring the breadth and accuracy needed by decision-makers.
- 500+ SaaS businesses across 8 major verticals
- 18 months of live conversion data
- $10M-$1B+ ARR range
- Multiple validation sources
What’s Included:
Benchmarks span major B2B SaaS verticals—marketing technology, CRM, HR, productivity, developer tools, finance, and compliance—across US, European, and Asian markets. Both product-led growth (PLG) and sales-led (demo/enterprise) models are included to represent the full spectrum of SaaS strategies.
- SMB, mid-market, and enterprise segments
- Product-led growth and sales-led models
- Geographic data across US, Europe, and Asia
Known Limitations:
- PLG segments typically report higher visitor-to-lead conversion rates due to frictionless opt-in and viral features; these figures may be above averages for traditional, sales-driven SaaS. (Source: UserPilot)
- Demo-led enterprise models generally show lower top-of-funnel (visitor/lead) conversions, but significantly higher close rates and average deal size downstream compared to SMB and PLG. (Source: WebStacks)
- Sampling bias toward companies already engaged in conversion optimization initiatives may result in slightly elevated reported metrics. (Source: Klickflow)
Industry Trend Analysis
Current Shifts:
- AI-driven personalization is now linked with 18–24% lifts in conversion in B2B SaaS. (Source: Klickflow)
- Remote work shortens SaaS sales cycles and raises adoption rates. (Source: Grafit)
- Frictionless buying and mobile-first UX now a baseline expectation. (Source: WebStacks)
Design Implications:
- Optimize for instant value demonstration (Source: Steve Krug)
- Build self-service capabilities
- Reduce implementation timelines
- Focus on mobile-first experiences (Source: Omnius)
Your Action Plan: Stop Leaving Money on the Table
What 18 Elite Revenue Leaders Actually Did in Their First 90 Days
The $100B+ CRO Playbook:
90-Day Implementation:
Weeks 1-2: Audit Phase
- Measure current performance against the relevant benchmarks on this page
- Identify biggest conversion gaps
- Calculate revenue opportunity using provided data
Weeks 3-8: Quick Wins
- Optimize page load speeds (target <400 milleseconds)

Doherty Threshold
Productivity soars when a computer and its users interact at a pace (<400ms) that ensures that neither has to wait on the other.
- Reduce form fields by 40%+ (as few as possible)
- Improve CTA clarity and placement
- Add social proof at conversion points
Weeks 9-12: Strategic Changes
- Overhaul onboarding for faster time-to-value
- Implement nurture sequences based on conversion timelines
- Set up proper multi-touch attribution (Source: GrowthJockey)
Success Metrics to Track:
- Bounce rate
- Website visitors to free trial signups
- End-to-end conversion rates by referral source
- Time-to-value and activation metrics
- Cohort retention by signup experience
The data is clear: top-performing SaaS companies engineer experiences that make technology invisible. Every interaction is designed to remove friction between intent and action.
Your conversion rate isn’t just a metric—it’s the multiplier that turns marketing spend into revenue and growth into category leadership.
Ready to optimize your conversion rates with data-driven design? Our agency Pixelswithin helps SaaS companies bridge conversion gaps through strategic product design and engineering improvements.
Your future will be magical.
Work With Us →

Leave a Reply